Does a Rising Bitcoin Tide Lift All Crypto Boats?
Using statistical analysis to determine correlation coefficient between crypto-pairs
Author: DeCryptofy
14 Mar 2023
Overheard somewhere deep in the cryptoverse...
Market Guy: Whats up with the crypto markets? Bitcoin has been rising since December 2022...
Data Guy: Yup. That’s right…
Market Guy: The other cryptos have also been rising. I am wondering if the rising Bitcoin tide is lifting all crypto boats equally or at all...?
Data Guy: Not sure. We need to check the data out, do a statistical analysis and determine if there is any correlation. Let us checkout if the charts and analysis on DeCryptofy provide some clues…!
In today’s post we look to answer the above question - “Does a rising Bitcoin tide lift all crypto boats…?”. We also look to answer some related nuances - “Does a rising Bitcoin tide lift all crypto boats similarly? Across crypto-exchanges? And are they the same over time?”
In other words, is there a correlation between Bitcoin price and prices of other crypto-currencies, over time, over various time slices, and across exchanges. Both a positive correlation (i.e. if Bitcoin rises, the other crypto-currency also rises) and a negative correlation (i.e. if Bitcoin rises, the other crypto-pair falls or vice-a-versa). This can be useful when you would like to track a diverse mix of crypto-pairs before making any selection decisions for your purposes - be that deciding your portfolio mix and allocations, or doing some scenario/ simulation analysis may be, or using stats and charts to look cool in your crypto podcast.
The typical measure used for determining correlation is the statistical measure known as the Pearson Correlation Coefficient commonly also known as the Correlation Coefficient, and commonly denoted by the symbol ‘r’ .
Refer these links for definitions of Correlation Coefficient - Wikipedia (nerdy explanation) and Investopedia (easier to understand)
Correlation coefficient values range from 1 (which represents a 1:1 correlation), to 0 (no correlation) to -1 (negative correlation). While correlation coefficients are useful, it is important to remember that correlation is not causation.
Correlation between leading crypto-pairs and BTC-USD
DeCryptofy looked at the correlation between 10 leading crypto-pairs and BTC-USD across Bittrex and Coinbase, to calculate the correlation coefficient for each of these crypto-pairs to BTC-USD. The crypto-pairs we looked at include the following:Correlation Coefficients for Time Slice 1-Apr-2022 to 15-Feb-2023
We calculated the correlation coefficients for the overall time period - 1-Apr-2022 to 15-Feb-2023. We also looked at correlation for various time slices such as last 45 days, 60 days, etc. The table below outlines the correlation coefficients for the overall time period 1-Apr-2022 to 15-Feb-2023.For a few sample crypto-pairs where the correlation is not as high, the table also provides correlation for different time slices to determine if the correlation varies over time (Quick answer - It does…)
| Crypto-Currency Pair | Correlation Coefficient (r) on Bittrex | Correlation Coefficient (r) on Coinbase | ||
|---|---|---|---|---|
| ETH-USD | 0.961 | 0.962 | ||
| XRP-USD | 0.808 | Not listed on Coinbase | ||
| ADA-USD | 0.951 | 0.952 | ||
| DOGE-USD | 0.712 | Time slice 4/1/22-10/25/22: 0.961 | 0.716 | Time slice 4/1/22-10/25/22: 0.962 |
| Time slice 12/28/22-1/25/23: 0.858 | Time slice 12/28/22-1/25/23: 0.953 | |||
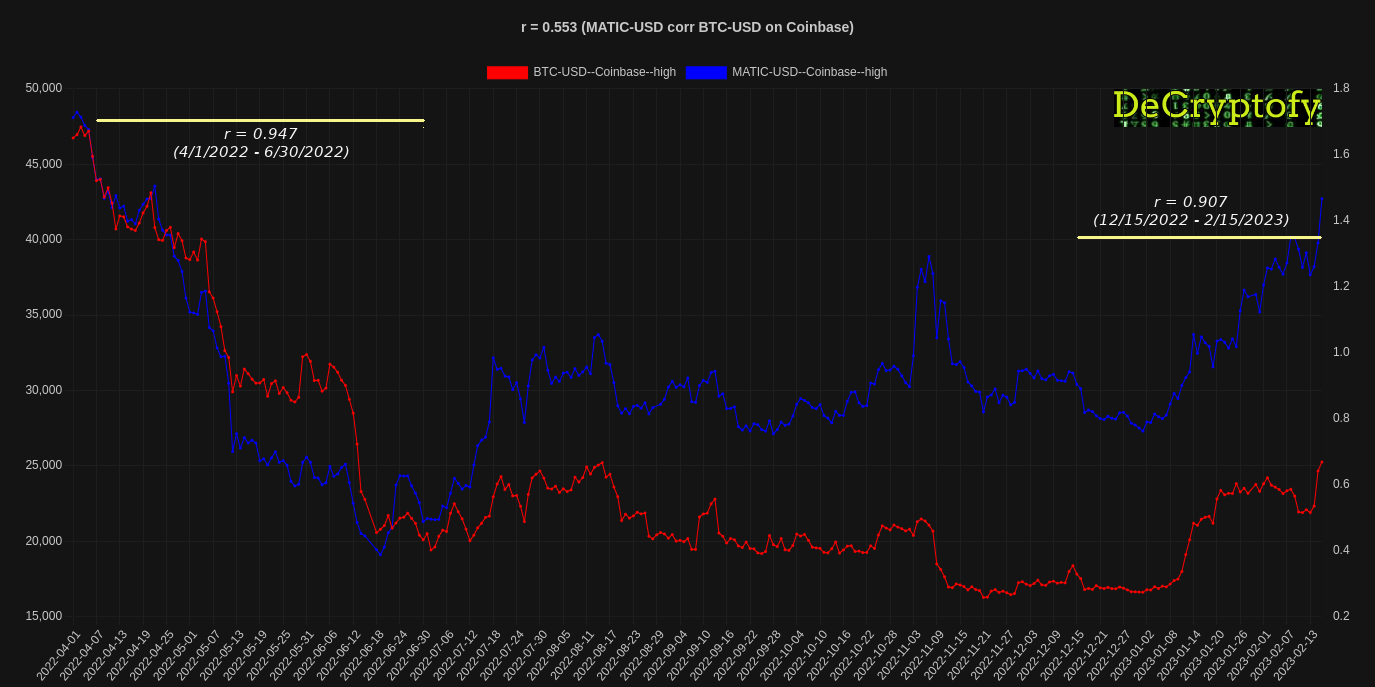
| MATIC-USD | 0.545 | Time slice 4/1/22-6/30/22: 0.947 | 0.553 | Time slice 4/1/22-6/30/22: 0.947 |
| Time slice 12/15/22-2/15/23: 0.907 | Time slice 12/15/22-2/15/23: 0.907 | |||
| DOT-USD | 0.968 | 0.97 | ||
| LTC-USD | 0.678 | Time slice 4/1/22-10/31/22: 0.958 | 0.673 | Time slice 4/1/22-10/31/22: 0.957 |
| Time slice 12/1/22-2/15/23: 0.915 | Time slice 12/1/22-2/15/23: 0.919 | |||
| SAND-USD (5/29 onwards) | 0.756 | 0.759 | ||
| SHIB-USD (7/14 onwards) | 0.303 | 0.841 | ||
| ATOM-USD | 0.775 | 0.775 | ||
Visualizing Correlation
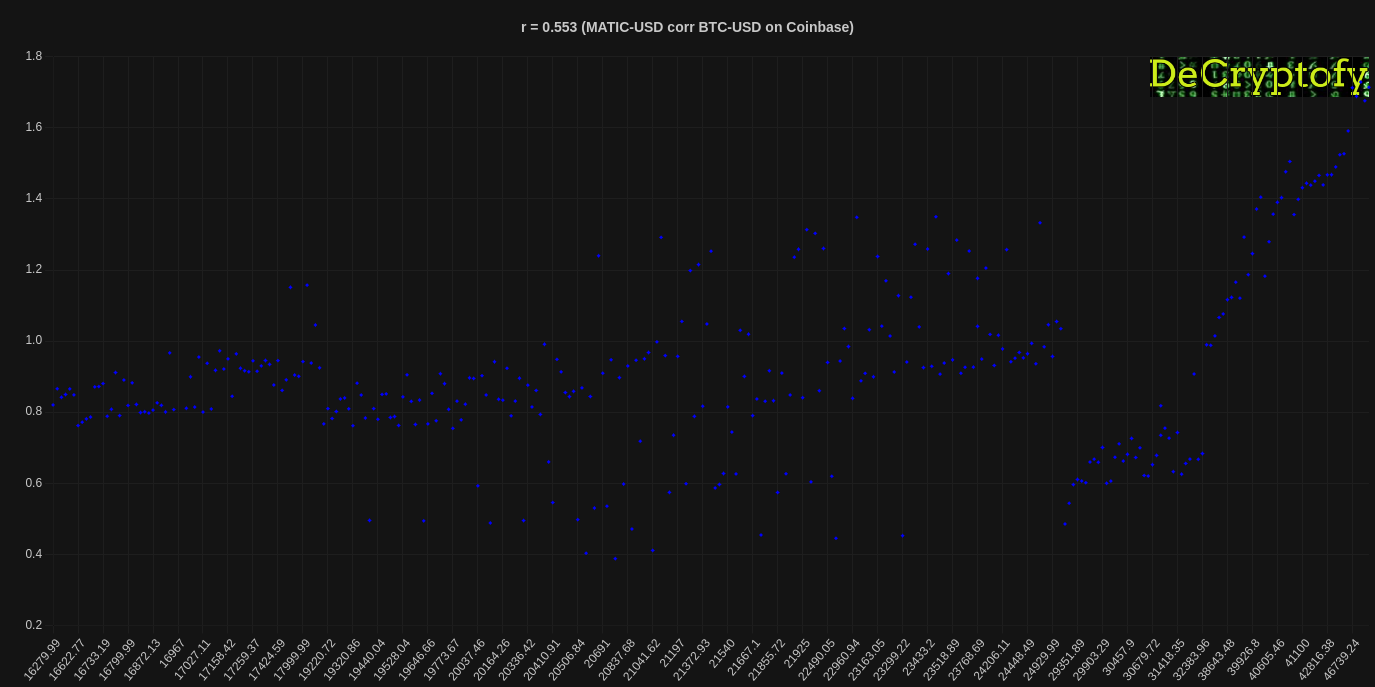
Correlations are better when seen as visual charts. Here are two charts for MATIC-USD correlation with BTC-USD - the daily time series chart from 1-Apr-2022 onwards, and the scatter plot charting MATIC-USD to BTC-USD. The time series chart also describes correlations for various time slices, within the overall time period. MATIC-USD corr BTC-USD - Time Series Chart

MATIC-USD corr BTC-USD - Scatter Plot

...But I want a dynamic, customizable Correlation Chart!
The chart is really cool. But how do I...
DeCryptofy now provides MyChart - a dynamic, interactive and customizable correlation chart and analysis tool. Data is included by default and is updated daily.
MyChart helps solve all of the above problems - you can select your own crypto-pairs, dynamically select time slices, select crypto-exchange, as also the crypto-metric you want to analze correlations for (such as daily high, low, volume).
Closing Note - Correlation Coefficients for the first 45 days of 2023
Getting back to the conversation in the Cryptoverse between the Market Guy and the Data Guy...is the rising Bitcoin tide lifting all crypto boats, at least so far in 2023?
So here they are - the correlation coefficients for the first 45 days of 2023.
We will leave you to make your own judgement if these are closely correlated. You can use MyChart to determine correlation beyond 15-Feb-2023. And a reminder... correlation is not causation.
So here they are - the correlation coefficients for the first 45 days of 2023.
We will leave you to make your own judgement if these are closely correlated. You can use MyChart to determine correlation beyond 15-Feb-2023. And a reminder... correlation is not causation.
| Crypto-Currency Pair | Correlation Coefficient (r) on Bittrex | Correlation Coefficient (r) on Coinbase |
|---|---|---|
| ETH-USD | 0.976 | 0.976 |
| XRP-USD | 0.942 | Not listed on Coinbase |
| ADA-USD | 0.948 | 0.948 |
| DOGE-USD | 0.851 | 0.924 |
| MATIC-USD | 0.850 | 0.846 |
| DOT-USD | 0.973 | 0.972 |
| LTC-USD | 0.902 | 0.898 |
| SAND-USD | 0.950 | 0.944 |
| SHIB-USD | 0.845 | 0.876 |
| ATOM-USD | 0.933 | 0.933 |
Join the Conversation